. 2021 Aug 9;6(15):e150698.
doi: 10.1172/jci.insight.150698.

Scn2a severe hypomorphic mutation decreases excitatory synaptic input and causes autism-associated behaviors

Affiliations

Scn2a severe hypomorphic mutation decreases excitatory synaptic input and causes autism-associated behaviors

Hong-Gang Wang et al. JCI Insight. .

Abstract

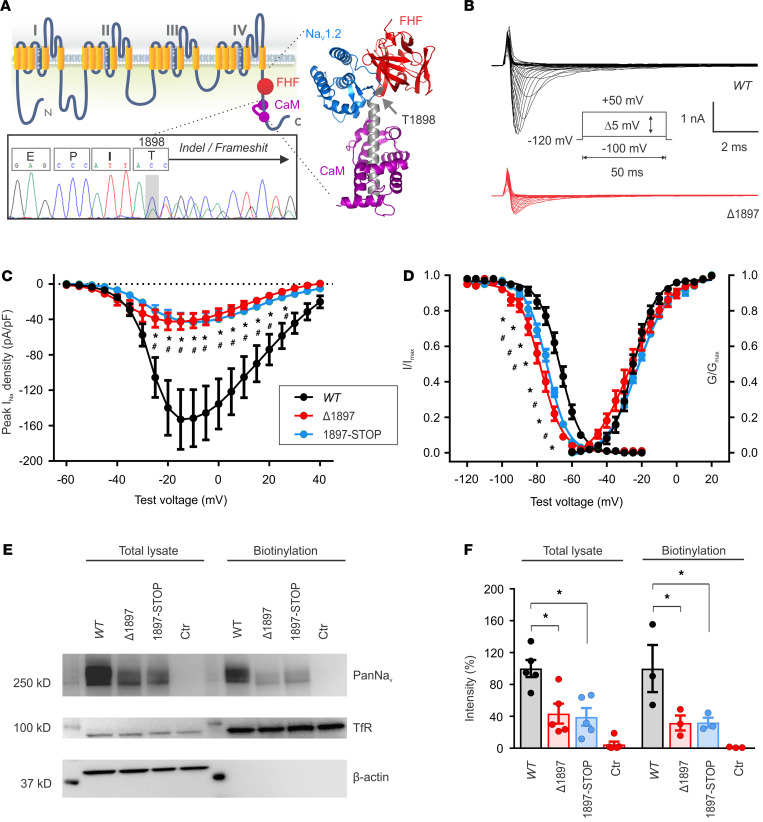
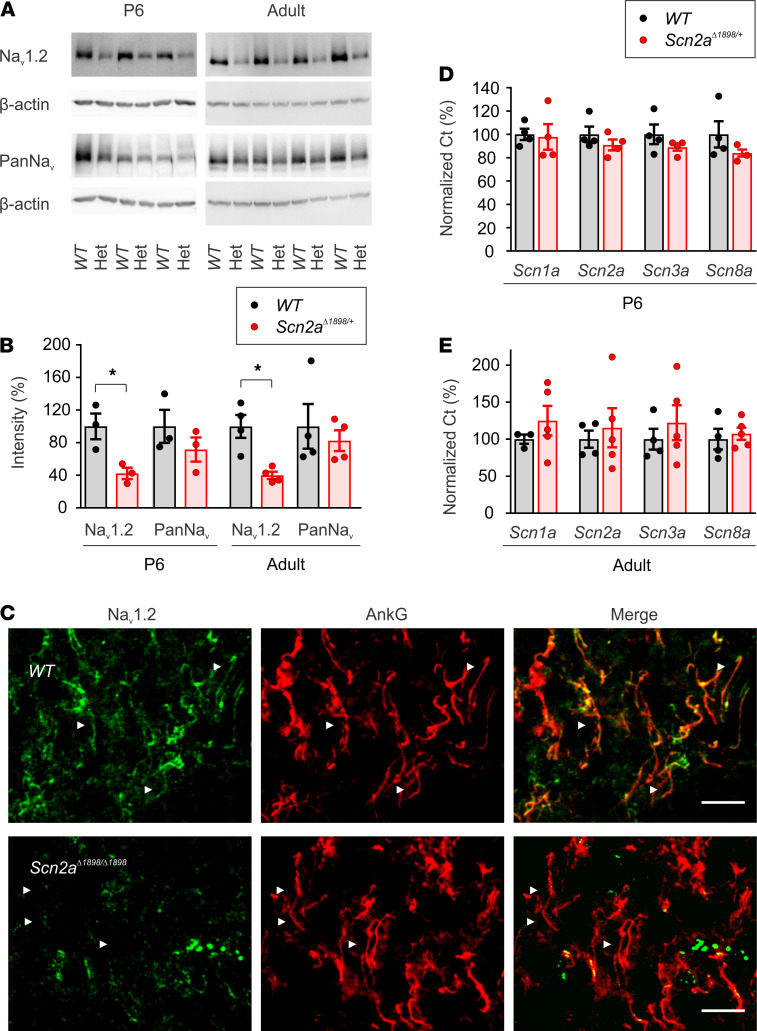
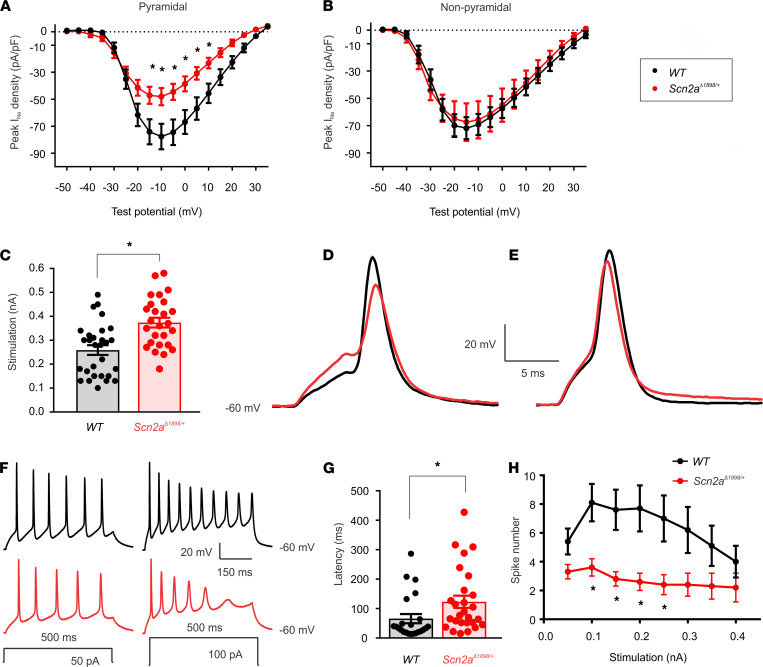
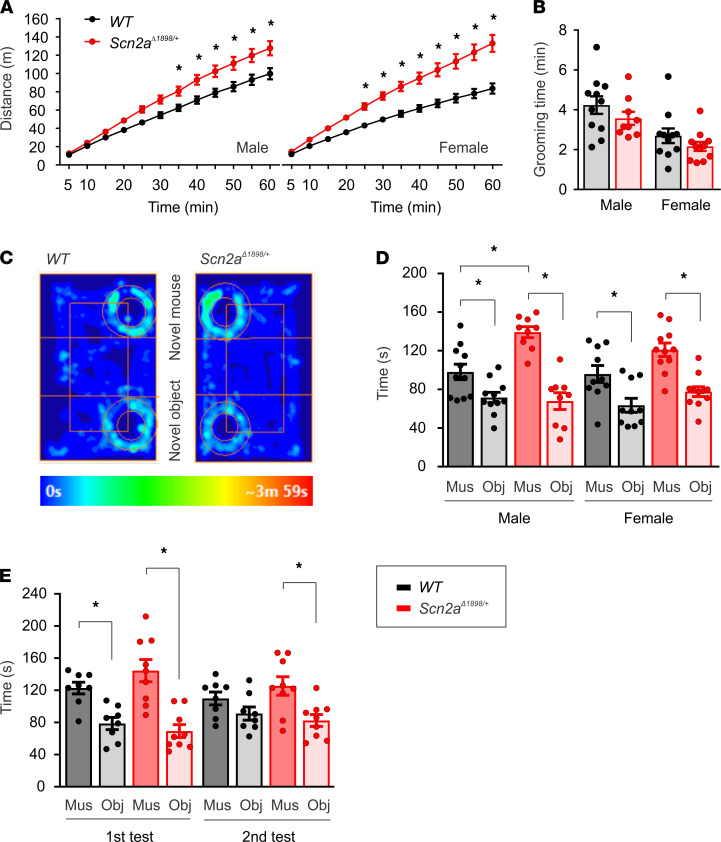
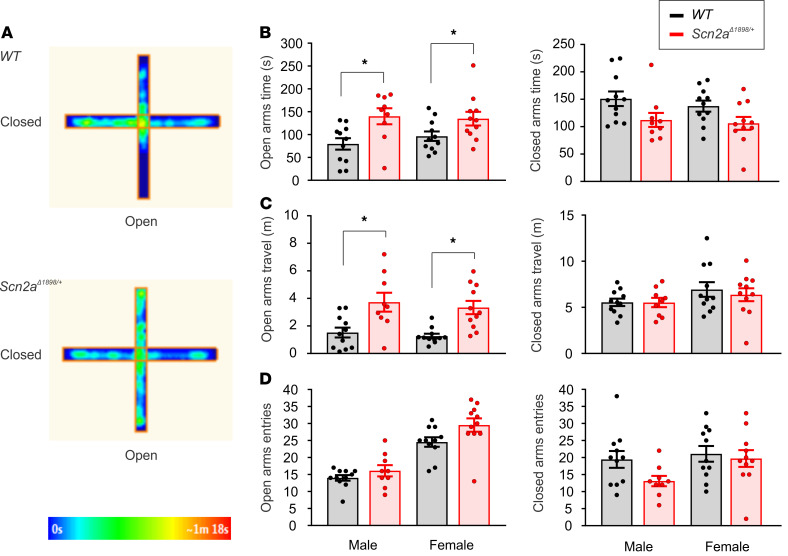
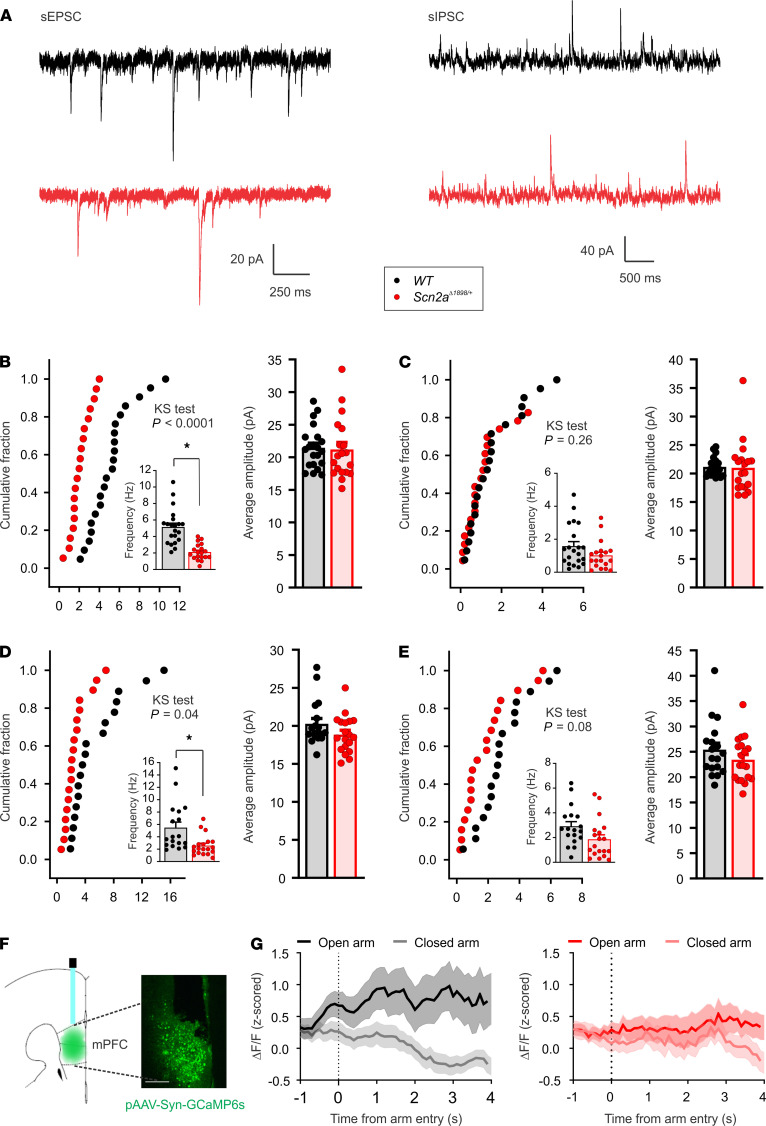
SCN2A, encoding the neuronal voltage-gated Na+ channel NaV1.2, is one of the most commonly affected loci linked to autism spectrum disorders (ASDs). Most ASD-associated mutations in SCN2A are loss-of-function mutations, but studies examining how such mutations affect neuronal function and whether Scn2a mutant mice display ASD endophenotypes have been inconsistent. We generated a protein truncation variant Scn2a mouse model (Scn2aΔ1898/+) by CRISPR that eliminates the NaV1.2 channel's distal intracellular C-terminal domain, and we analyzed the molecular and cellular consequences of this variant in a heterologous expression system, in neuronal culture, in brain slices, and in vivo. We also analyzed multiple behaviors in WT and Scn2aΔ1898/+ mice and correlated behaviors with clinical data obtained in human subjects with SCN2A variants. Expression of the NaV1.2 mutant in a heterologous expression system revealed decreased NaV1.2 channel function, and cultured pyramidal neurons isolated from Scn2aΔ1898/+ forebrain showed correspondingly reduced voltage-gated Na+ channel currents without compensation from other CNS voltage-gated Na+ channels. Na+ currents in inhibitory neurons were unaffected. Consistent with loss of voltage-gated Na+ channel currents, Scn2aΔ1898/+ pyramidal neurons displayed reduced excitability in forebrain neuronal culture and reduced excitatory synaptic input onto the pyramidal neurons in brain slices. Scn2aΔ1898/+ mice displayed several behavioral abnormalities, including abnormal social interactions that reflect behavior observed in humans with ASD and with harboring loss-of-function SCN2A variants. This model and its cellular electrophysiological characterizations provide a framework for tracing how a SCN2A loss-of-function variant leads to cellular defects that result in ASD-associated behaviors.

Keywords: Ion channels; Mouse models; Neuroscience.


Conflict of interest statement

Conflict of interest: The authors have declared that no conflict of interest exists.

Figures

Figure 1
Figure 1. NaV1.2Δ1897 channels display reduced peak Na+ current density in transfected cells.
(A) Schematic of the NaV1.2 pore-forming α subunit. The bottom inset showing genomic DNA sequencing, which demonstrates the T1898N frameshift in one of the alleles in Scn2aΔ1898/+ mice. The right inset shows the location of T1898 on the crystal structure (Protein Data Bank entry: 4JPZ) of the ternary complex of the NaV1.2 C-terminal domain (CTD, blue; truncated helix shown in gray), FGF13 (FHF, red), and calmodulin (purple). The arrow indicates the location of T1898. (B) Exemplar current traces for NaV1.2WT and the frameshifted/truncated NaV1.2Δ1897 channel (p. T1897NsfX27, equivalent to T1898 in mice) expressed in HEK293 cells. (C) Peak current density-voltage relationships for NaV1.2WT (n = 11), NaV1.2Δ1897 (Δ1897, n = 11), and a NaV1.2 with a stop codon inserted at T1897 (1897–STOP, n = 12). Asterisks represent 2-way ANOVA followed by Dunnett’s multiple-comparison test. Peak INa density × mutation, F(40, 620) = 9.732, P < 0.0001. (D) Steady-state inactivation (I/Imax) (WT, n = 15; Δ1897, n = 11; 1897–STOP, n = 12) and activation (G/Gmax) relationships for the 3 channels. Asterisks represent 2-way ANOVA followed by Dunnett’s multiple-comparison test. I/Imax × mutation, F(40, 700) = 12.34, P < 0.0001. (E) Exemplar immunoblot of whole cell lysates or the biotinylated surface fraction from HEK293 cells expressing the 3 channels. Transferrin receptor (TfR) and actin represent a membrane and cytoplasmic marker, respectively, that demonstrate successful separation of the biotinylated membrane fraction. Molecular weight markers are shown on the left. See complete unedited blots in the supplemental material. (F) Quantification of intensities (relative to WT) from immunoblots (total lysate, n = 5; biotinylation, n = 3). Asterisks represent 1-way ANOVA followed by Dunnett’s multiple-comparison test. Total lysate, F(3, 16) = 15.4, P < 0.0001; NaV1.2WT versus NaV1.2Δ1897, P = 0.0029; NaV1.2WT versus 1897–STOP, P = 0.0016. Biotinylation, F(3, 8) = 6.963, P = 0.01; NaV1.2WT versus Δ1897, P = 0.04; NaV1.2WT versus 1897–STOP, P = 0.04.
Figure 2
Figure 2. Cortices from Scn2aΔ1898/+ mice have less total and NaV1.2 NaV channels.
(A) Immunoblots for NaV1.2 (anti-NaV1.2, recognizes amino acids 1882–2005) or total voltage-gated Na+ channel (PanNaV) in brain cortex lysates from P6 (n = 3) or adult (~5 month, n = 4) WT or Scn2aΔ1898/+ (Het) mice. Molecular weights are shown on the left. See complete unedited blots in the supplemental material. (B) β-Actin serves as a loading control and for normalization in B, which shows the quantification of NaV1.2 and total Na+ channels as in A, normalized to WT. Asterisks represent unpaired t test, t(4) = 3.348, P = 0.03 for P6; t(6) = 4.07, P = 0.007 for adult. (C) IHC of layer 2/3 in cortex from P0.5 mice stained with anti-NaV1.2 and anti–ankyrin G (AnkG) antibodies. The arrows indicate axonal NaV1.2 or AnkG. Scale bar: 10 μm. (D and E) Relative (normalized to GAPDH) CNS Na+ channel transcripts quantified by qPCR in P3–P6 (n = 4) and adult (~5 month; WT, n = 4; Scn2aΔ1898/+, n = 5) cortex, respectively.
Figure 3
Figure 3. Cortical neurons from Scn2aΔ1898/+ mice display reduced NaV channel current and reduced excitability.
(A) Current-voltage relationship for excitatory (pyramidal) neurons (WT, n = 14; Scn2aΔ1898/+, n = 17). Asterisks represent 2-way ANOVA followed by Sidak’s multiple-comparison test. Peak INa density × genotype, F(16, 464) = 6.73, P < 0.0001. (B) Current-voltage relationship for inhibitory (nonpyramidal) neurons (WT, n = 12; Scn2aΔ1898/+, n = 12). (C) Stimulation threshold to elicit action potentials in cultured cortical neurons isolated from WT (n = 29) or Scn2aΔ1898/+ (n = 26). Asterisks represent unpaired t test, t(53) = 3.961, P = 0.0002. (D) Exemplar action potentials from WT or Scn2aΔ1898/+ elicited at threshold stimulation. (E) Exemplar action potentials from WT or Scn2aΔ1898/+ elicited at a stimulation intensity (0.4 ± 0.03 nA and 0.6 ± 0.02 nA, for WT and Scn2aΔ1898/+, respectively) that elicits the maximal amplitude. (F) Exemplar evoked action potential trains elicited from WT (n = 23) or Scn2aΔ1898/+ (n = 27) with 500 ms current injection of 50 pA or 100 pA. The resting membrane potential is indicated (bottom right). (G) Latency of first spike at minimum stimulation intensity. Asterisks represent unpaired t test, t(48) = 2.135, P = 0.038. (H) The number of evoked action potentials for the indicated intensity of current injection. Asterisks represent 2-way ANOVA followed by Sidak’s multiple-comparison test. Spike number × genotype, F(11, 528) = 6.693, P < 0.0001.
Figure 4
Figure 4. Scn2aΔ1898/+ mice display hyperactivity in a novel environment and show increased social interactions.
(A) Hyperactivity in Scn2aΔ1898/+ male and female mice compared with WT littermate controls in an open field (male: WT, n = 11 and Scn2aΔ1898/+, n = 9; female: WT, n = 11 and Scn2aΔ1898/+, n = 11). Asterisks represent 2-way ANOVA followed by Sidak’s multiple-comparison test. Distance × genotype, F(11, 198) = 8.278 for male and F(11, 220) = 16.27 for female, P < 0.0001. (B) Grooming time. (C) Heatmaps from 3 chamber social interaction tests for WT (male, n = 11; female, n = 10) and Scn2aΔ1898/+ (male, n = 9; female, n = 11) mice. (D) Time spent with novel mouse (Mus) or novel object (Obj) in the 3-chamber social interaction test. Asterisks represent 2-way ANOVA followed by Tukey’s multiple-comparison test. Mus or Obj × genotype, F(1, 36) = 9.963, P = 0.003 for male; F(1, 38) = 0.5996, P = 0.445 for female. Mus versus Obj: Tukey’s multiple-comparison test; WT, P = 0.04; Scn2aΔ1898/+, P < 0.0001 for male; WT, P = 0.02; Scn2aΔ1898/+, P = 0.0004 for female. (E) Repeated 3 3-chamber social interaction tests in a separate cohort of male WT (n = 8) and Scn2aΔ1898/+ (n = 9) mice. Unpaired t test was used to evaluate the difference in time spent between Mus and Obj. Both WT (t(14) = 4.174, P = 0.0009) and Scn2aΔ1898/+ (t(16) = 4.721, P = 0.0002) mice spent more time with novel Mus over Obj during the first test, but only Scn2aΔ1898/+ mice displayed a social preference 3 hours later (second test) to the familiar Mus (t(16) = 3.149, P = 0.0062).
Figure 5
Figure 5. Scn2aΔ1898/+ mice display increased time and traveled distance on the EPM open arms.
(A) Exemplar heatmaps for WT (male, n = 11; female, n = 11) and Scn2aΔ1898/+ (male, n = 9; female, n = 11) on the EPM. (B) Time spent in the open and closed arms. Asterisks represent unpaired t test; t(18) = 2.886, P = 0.01 for male; t(20) = 2.103, P = 0.048 for female. (C) Distance traveled in the open and closed arms. Asterisks represent unpaired t test; t(18) = 2.998, P = 0.008 for male; t(20) = 4.07, P = 0.001 for female. (D) Number of entries to the open and closed arms.
Figure 6
Figure 6. Pyramidal neurons in mPFC and BLA from Scn2aΔ1898/+ mice display altered excitability and synaptic properties.
(A) Exemplar sEPSCs and sIPSCs recorded in pyramidal neurons from Scn2aΔ1898/+ and WT mice at holding potential of –50 mV and 0 mV, respectively. WT, black; Scn2aΔ1898/+, red. (B and C) Quantification of frequency and amplitude of sEPSCs and sIPSCs (Scn2aΔ1898/+, n = 19; WT, n = 21) recorded in layer 5/6 pyramidal neurons in mPFC. Frequency of sEPSCs reduced as shown in both cumulative fraction and average (inset, asterisks represent unpaired t test, t(38) = 5.691, P < 0.0001). (D and E) Quantification of frequency and amplitude of sEPSCs and sIEPSCs (Scn2aΔ1898/+, n = 19; WT, n = 18) recorded in pyramidal neurons in BLA. Frequency of sEPSCs reduced as shown in both cumulative fraction and average (inset, asterisks represent unpaired t test, t(35) = 3.027, P = 0.005). The cumulative frequency distributions were analyzed with the Kolmogorov-Smirnov comparison (KS test) in BE. (F) Microscopic graph showing the GCaMP6s virus expression and fiber placement in mPFC. (G) Calcium dynamics in GCaMP6s-expressed neurons with fiber photometry recording during EPM. In contrast to WT mice, Scn2aΔ1898/+ mice failed to show an increase in fluorescence [Ca2+] signal when mice entered the open arms compared with the closed arms.

Similar articles

Cited by

References

    1. Yamagata T, et al. Nav1.2 is expressed in caudal ganglionic eminence-derived disinhibitory interneurons: mutually exclusive distributions of Nav1.1 and Nav1.2. Biochem Biophys Res Commun. 2017;491(4):1070–1076. doi: 10.1016/j.bbrc.2017.08.013. - DOI - PubMed
    1. Boiko T, et al. Compact myelin dictates the differential targeting of two sodium channel isoforms in the same axon. Neuron. 2001;30(1):91–104. doi: 10.1016/S0896-6273(01)00265-3. - DOI - PubMed
    1. Boiko T, et al. Functional specialization of the axon initial segment by isoform-specific sodium channel targeting. J Neurosci. 2003;23(6):2306–2313. doi: 10.1523/JNEUROSCI.23-06-02306.2003. - DOI - PMC - PubMed
    1. Gatto CL, Broadie K. Genetic controls balancing excitatory and inhibitory synaptogenesis in neurodevelopmental disorder models. Front Synaptic Neurosci. 2010;2:4. - PMC - PubMed
    1. O’Roak BJ, et al. Multiplex targeted sequencing identifies recurrently mutated genes in autism spectrum disorders. Science. 2012;338(6114):1619–1622. doi: 10.1126/science.1227764. - DOI - PMC - PubMed

Publication types

Substances