

Single-channel activations and concentration jumps: comparison of recombinant NR1a/NR2A and NR1a/NR2D NMDA receptors
- PMID: 9625862
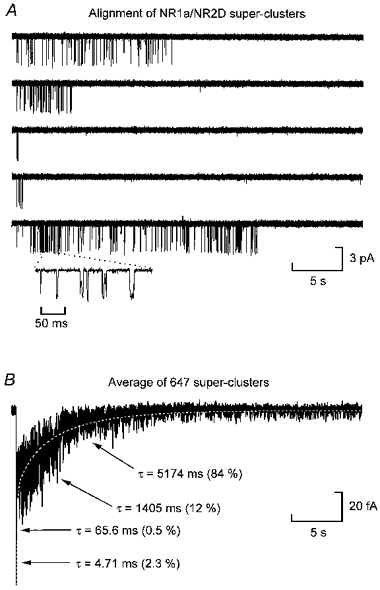
- PMCID: PMC2231013
- DOI: 10.1111/j.1469-7793.1998.001bz.x
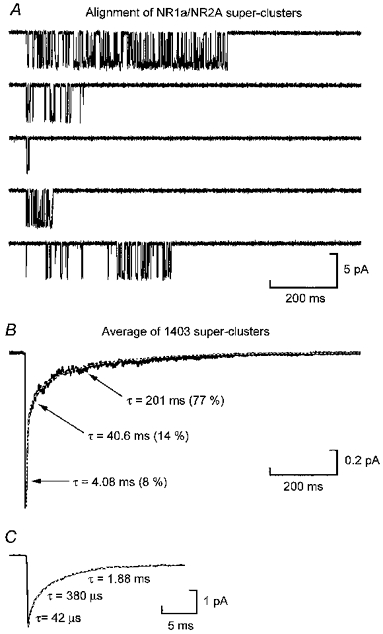
Single-channel activations and concentration jumps: comparison of recombinant NR1a/NR2A and NR1a/NR2D NMDA receptors
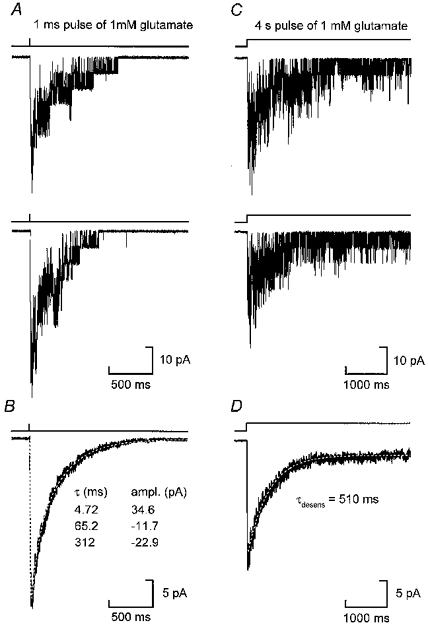
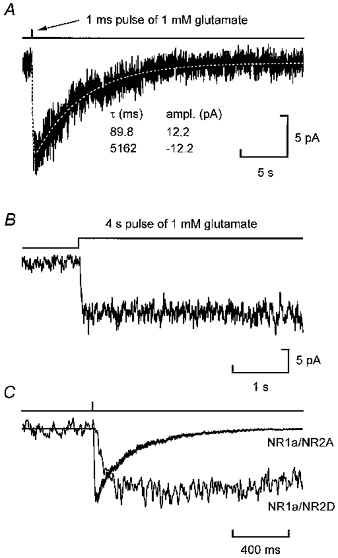
Erratum in
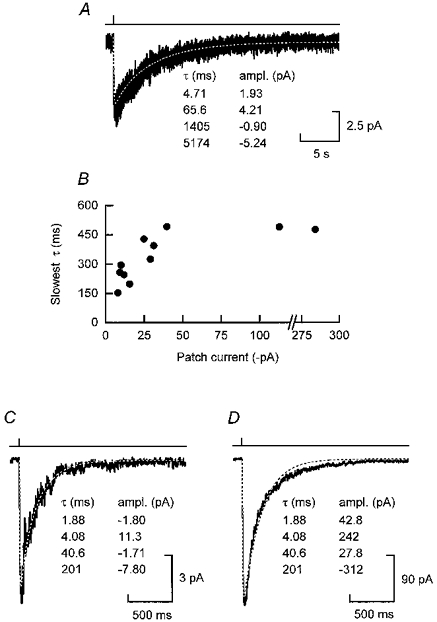
- J Physiol (Lond) 1998 Nov 1;512(Pt 3):939
Abstract
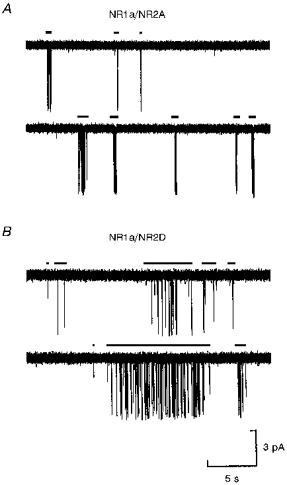
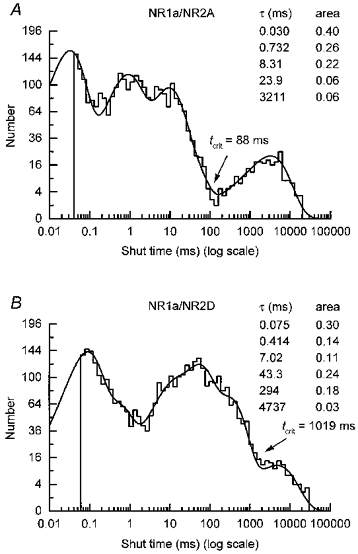
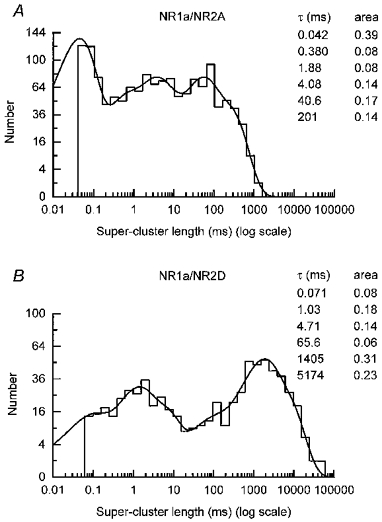
1. We have expressed recombinant NR1a/NR2A and NR1a/NR2D N-methyl-D-aspartate (NMDA) receptor channels in Xenopus oocytes and made recordings of single-channel and macroscopic currents in outside-out membrane patches. For each receptor type we measured (a) the individual single-channel activations evoked by low glutamate concentrations in steady-state recordings, and (b) the macroscopic responses elicited by brief concentration jumps with high agonist concentrations, and we explore the relationship between these two sorts of observation. 2. Low concentration (5-100 nM) steady-state recordings of NR1a/NR2A and NR1a/NR2D single-channel activity generated shut-time distributions that were best fitted with a mixture of five and six exponential components, respectively. Individual activations of either receptor type were resolved as bursts of openings, which we refer to as 'super-clusters'. 3. During a single activation, NR1a/NR2A receptors were open for 36 % of the time, but NR1a/NR2D receptors were open for only 4 % of the time. For both, distributions of super-cluster durations were best fitted with a mixture of six exponential components. Their overall mean durations were 35.8 and 1602 ms, respectively. 4. Steady-state super-clusters were aligned on their first openings and averaged. The average was well fitted by a sum of exponentials with time constants taken from fits to super-cluster length distributions. It is shown that this is what would be expected for a channel that shows simple Markovian behaviour. 5. The current through NR1a/NR2A channels following a concentration jump from zero to 1 mM glutamate for 1 ms was well fitted by three exponential components with time constants of 13 ms (rising phase), 70 ms and 350 ms (decaying phase). Similar concentration jumps on NR1a/NR2D channels were well fitted by two exponentials with means of 45 ms (rising phase) and 4408 ms (decaying phase) components. During prolonged exposure to glutamate, NR1a/NR2A channels desensitized with a time constant of 649 ms, while NR1a/NR2D channels exhibited no apparent desensitization. 6. We show that under certain conditions, the time constants for the macroscopic jump response should be the same as those for the distribution of super-cluster lengths, though the resolution of the latter is so much greater that it cannot be expected that all the components will be resolvable in a macroscopic current. Good agreement was found for jumps on NR1a/NR2D receptors, and for some jump experiments on NR1a/NR2A. However, the latter were rather variable and some were slower than predicted. Slow decays were associated with patches that had large currents.
Figures
Similar articles
-
Single-channel analysis of an NMDA receptor possessing a mutation in the region of the glutamate binding site.J Physiol. 2000 Sep 1;527 Pt 2(Pt 2):225-37. doi: 10.1111/j.1469-7793.2000.00225.x. J Physiol. 2000. PMID: 10970425 Free PMC article.
-
Single-channel currents from recombinant NMDA NR1a/NR2D receptors expressed in Xenopus oocytes.Proc Biol Sci. 1996 Aug 22;263(1373):1079-86. doi: 10.1098/rspb.1996.0159. Proc Biol Sci. 1996. PMID: 8805841
-
Influence of a threonine residue in the S2 ligand binding domain in determining agonist potency and deactivation rate of recombinant NR1a/NR2D NMDA receptors.J Physiol. 2004 Jul 1;558(Pt 1):45-58. doi: 10.1113/jphysiol.2004.063800. Epub 2004 Apr 23. J Physiol. 2004. PMID: 15107472 Free PMC article.
-
Single channel analysis of a novel NMDA channel from Xenopus oocytes expressing recombinant NR1a, NR2A and NR2D subunits.J Physiol. 2000 Aug 1;526 Pt 3:481-91. J Physiol. 2000. PMID: 10922001
-
Effects of memantine on recombinant rat NMDA receptors expressed in HEK 293 cells.Br J Pharmacol. 1996 Sep;119(2):195-204. doi: 10.1111/j.1476-5381.1996.tb15971.x. Br J Pharmacol. 1996. PMID: 8886398 Free PMC article.
Cited by
-
The dissociation of acetylcholine from open nicotinic receptor channels.Proc Natl Acad Sci U S A. 2001 Nov 20;98(24):14102-7. doi: 10.1073/pnas.251402498. Proc Natl Acad Sci U S A. 2001. PMID: 11717464 Free PMC article.
-
Agonist-activated ion channels.Br J Pharmacol. 2006 Jan;147 Suppl 1(Suppl 1):S17-26. doi: 10.1038/sj.bjp.0706502. Br J Pharmacol. 2006. PMID: 16402101 Free PMC article. Review.
-
Qualitative review on N-methyl-D-aspartate receptor expression in rat spinal cord during the postnatal development: Implications for central sensitization and pain.Dev Neurobiol. 2020 Nov;80(11-12):443-455. doi: 10.1002/dneu.22789. Epub 2020 Nov 20. Dev Neurobiol. 2020. PMID: 33131183 Free PMC article.
-
Desensitization contributes to the synaptic response of gain-of-function mutants of the muscle nicotinic receptor.J Gen Physiol. 2006 Nov;128(5):615-27. doi: 10.1085/jgp.200609570. J Gen Physiol. 2006. PMID: 17074980 Free PMC article.
-
Modulation of glycine potency in rat recombinant NMDA receptors containing chimeric NR2A/2D subunits expressed in Xenopus laevis oocytes.J Physiol. 2008 Jan 1;586(1):227-45. doi: 10.1113/jphysiol.2007.143172. Epub 2007 Oct 25. J Physiol. 2008. PMID: 17962328 Free PMC article.
References
-
- Akazawa C, Shigemoto R, Bessho Y, Nakanishi S, Mizuno N. Differential expression of five N-methyl-D-aspartate receptor subunit mRNAs in the cerebellum of developing and adult rats. Journal of Comparative Neurology. 1994;347:150–160. - PubMed
-
- Béhé P, Stern P, Wyllie DJA, Nassar M, Schoepfer R, Colquhoun D. Determination of NMDA NR1 subunit copy number in recombinant NMDA receptors. Proceedings of the Royal Society. 1995;B 262:205–213. - PubMed
-
- Clements JD, Lester RAJ, Tong G, Jahr CE, Westbrook GL. The time course of glutamate in the synaptic cleft. Science. 1992;238:1498–1501. - PubMed
Publication types
MeSH terms
Substances
LinkOut - more resources
Full Text Sources
Other Literature Sources